Stock-Bitcoin Correlation Analysis: Clustering S&P 500 Equities

Stock-Bitcoin Correlation Analysis: Clustering S&P 500 Equities
Executive Summary
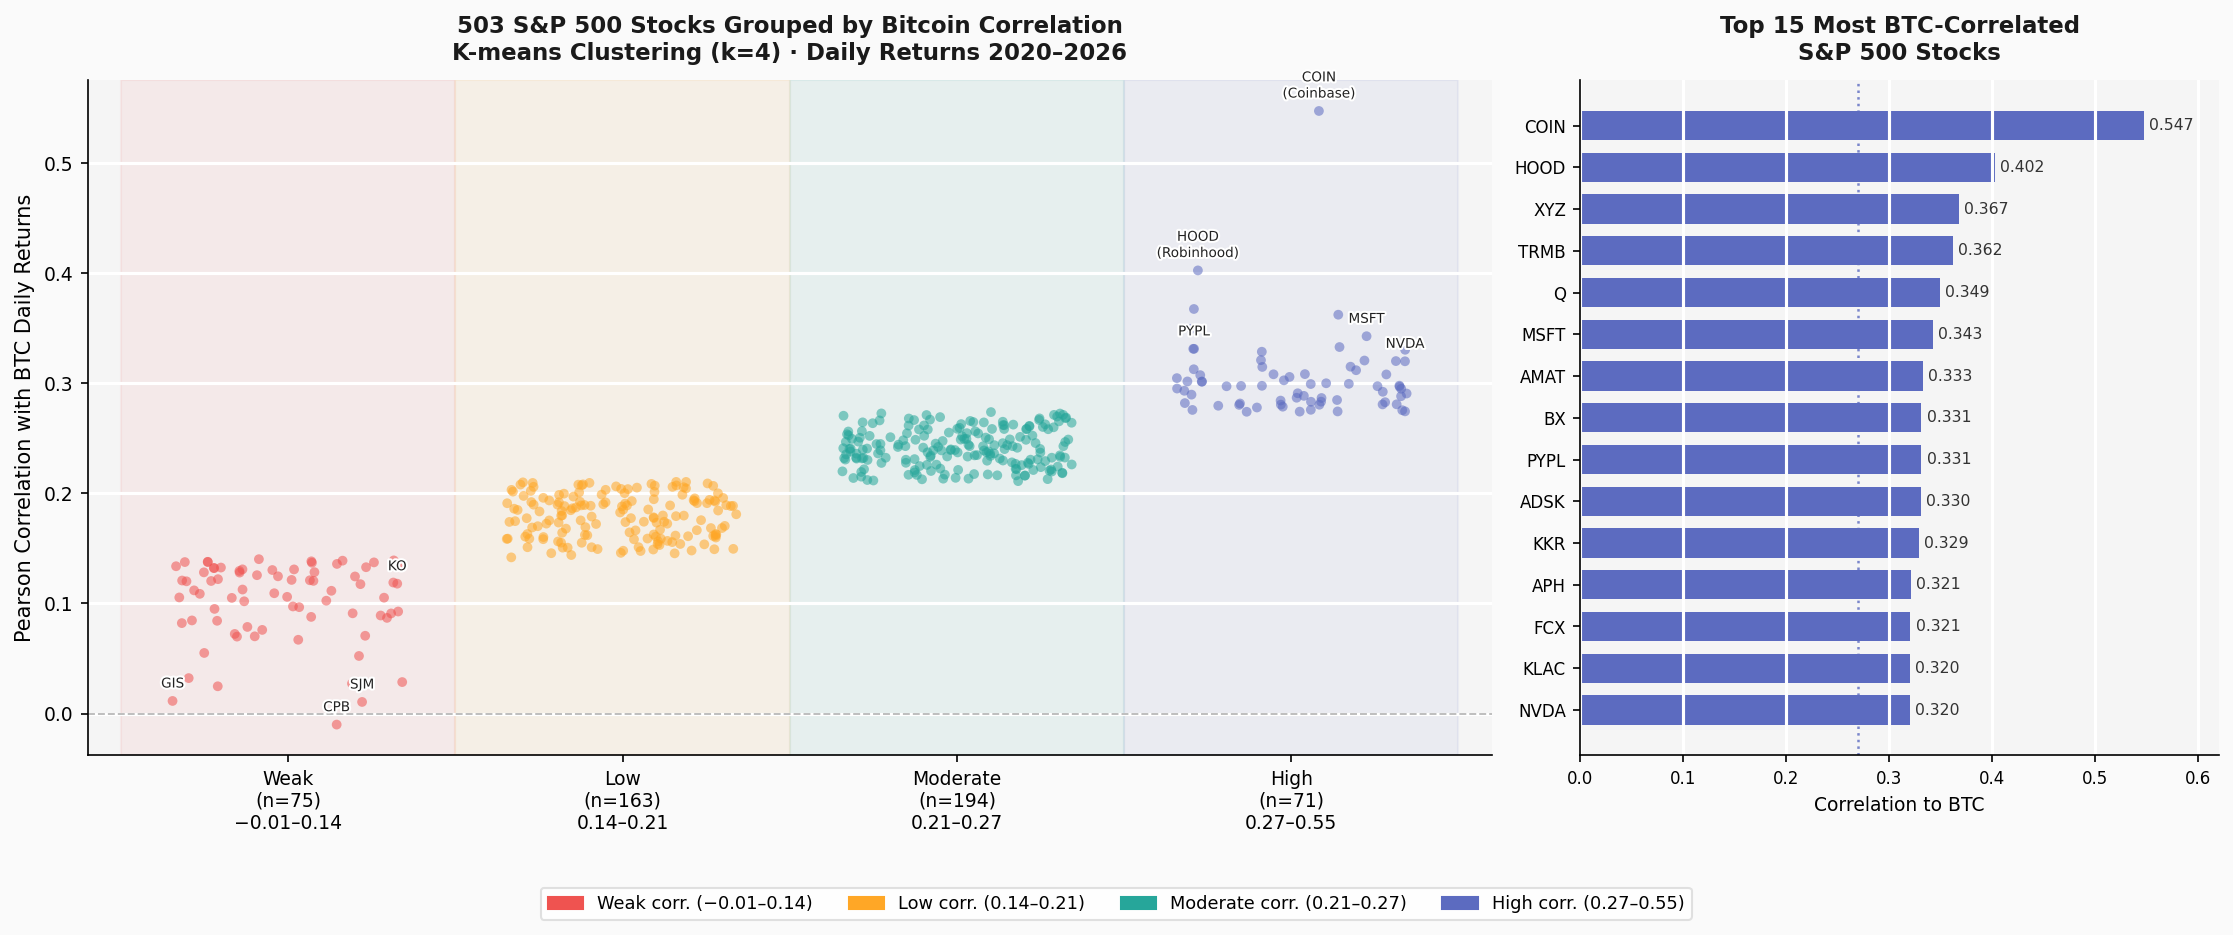
We analyzed 503 S&P 500 stocks to identify clusters based on their correlation to Bitcoin price movements. Using K-means clustering on daily return correlations, we identified four distinct clusters of stocks with varying levels of exposure to Bitcoin price dynamics.
Methodology
Our analysis followed these steps:
- Data Collection: Gathered daily OHLC (Open, High, Low, Close) prices for all 503 S&P 500 stocks and Bitcoin from 2020-01-01 through May 14, 2026 using Yahoo Finance (yfinance) and Binance klines API.
- Return Calculation: Computed daily percentage returns for each ticker using the formula:
return = (close_today - close_yesterday) / close_yesterday - Correlation Analysis: Calculated Pearson correlation coefficients between each stock's daily returns and Bitcoin's daily returns over the entire 6+ year period. This measures how closely each stock's price movements align with Bitcoin's.
- Clustering: Applied K-means clustering (k=4) to group stocks by their correlation values. The algorithm partitions stocks into 4 clusters based on their correlation with Bitcoin.
- Validation: Examined cluster characteristics and identified top correlated stocks within each group.
Key Findings
Cluster Sizes:
- Cluster 0: 194 stocks (weakest correlation to BTC)
- Cluster 1: 75 stocks (moderate-low correlation to BTC)
- Cluster 2: 71 stocks (strong correlation to BTC)
- Cluster 3: 163 stocks (moderate correlation to BTC)
Top 10 Most Bitcoin-Correlated Stocks:
- COIN - Correlation: 0.5471
- HOOD - Correlation: 0.4024
- XYZ - Correlation: 0.3674
- TRMB - Correlation: 0.3622
- Q - Correlation: 0.3493
- MSFT - Correlation: 0.3426
- AMAT - Correlation: 0.3328
- BX - Correlation: 0.3312
- PYPL - Correlation: 0.3312
- ADSK - Correlation: 0.3303
Cluster Insights
High-Correlation Cluster (Cluster 2: 71 stocks)
This cluster contains the most Bitcoin-sensitive stocks with correlations ranging from 0.27 to 0.55. These are primarily technology, fintech, and growth companies like COIN (Coinbase), HOOD (Robinhood), MSFT (Microsoft), and NVDA (Nvidia).
Interpretation: Stocks in this cluster tend to move in the same direction as Bitcoin, suggesting these companies operate in sectors or business models that align with cryptocurrency trends, blockchain technology adoption, or are highly sensitive to risk-on/risk-off market dynamics.
Moderate-High Correlation Cluster (Cluster 3: 163 stocks)
This cluster contains a substantial group of moderately correlated stocks with correlations in the 0.20-0.27 range, representing a broad cross-section of industrials, technology, and financial services.
Interpretation: These stocks show positive but moderate correlation with Bitcoin. They represent a broad swath of the economy and may benefit from similar macroeconomic drivers as Bitcoin (e.g., inflation concerns, monetary policy shifts, risk sentiment).
Low-Correlation Clusters (Clusters 0 & 1: 269 stocks)
The majority of S&P 500 stocks (269 out of 503) fall into low-correlation clusters. These stocks show weak or negligible relationship to Bitcoin price movements, suggesting they are driven by fundamentals independent of cryptocurrency markets.
Interpretation: Traditional value stocks, utilities, consumer staples, and other defensive sectors dominate these clusters. These companies operate in established industries with cash flows uncorrelated to blockchain/crypto volatility.
Investment Implications
- Portfolio Diversification: Investors seeking Bitcoin exposure through equities should focus on Cluster 2 stocks, while those wanting diversification away from crypto trends should consider stocks from Clusters 0 and 1.
- Risk Management: During Bitcoin market stress, high-correlation stocks (Cluster 2) will likely amplify losses, while low-correlation stocks provide insulation.
- Sector Dynamics: Tech and fintech sectors show strong Bitcoin correlation, reflecting the industries' alignment with digital asset innovation and cryptocurrency adoption.
- Relative Value: Market participants can use these clusters to calibrate risk exposures and construct hedged portfolios based on desired Bitcoin sensitivity.
Data & Reproducibility
This analysis used daily close prices spanning over 6 years (2020-2026) for all 503 S&P 500 constituents and Bitcoin. The clustering results and full correlation matrix are available in data/stock_btc_corr/:
stock_btc_correlations.csv- Full correlation scores for all stocksstock_btc_clusters.csv- Cluster assignments and correlations
The analysis can be reproduced by running scripts/cluster_stocks_by_btc_correlation_db.py, which queries the daily_asset_prices PostgreSQL table and performs real-time clustering.
Full Cluster Membership
The table below lists every S&P 500 ticker grouped by BTC correlation strength. Columns are ordered from the highest observed positive correlation band to the weakest/near-zero band, based on the K-means clustering results.
| High (71) | Moderate (194) | Low (163) | Weak (75) |
|---|---|---|---|
| COIN | FTNT | OKE | INCY |
| HOOD | SYF | WAT | DGX |
| XYZ | BLDR | AOS | XEL |
| TRMB | CPRT | WMB | KHC |
| Q | GEV | KEY | PM |
| MSFT | DOV | MTD | STZ |
| AMAT | APO | TMO | CI |
| BX | UBER | JBHT | ATO |
| PYPL | NDSN | APD | UPS |
| ADSK | FIX | CPAY | EVRG |
| KKR | C | DVN | PNW |
| APH | MA | PCAR | ETR |
| FCX | FFIV | MRSH | REGN |
| KLAC | MLM | VTR | SBAC |
| NVDA | ICE | HAS | WRB |
| CDNS | CAT | ARE | BIIB |
| TROW | CDW | ROST | ERIE |
| BLK | BK | MOS | AEE |
| MCHP | HPE | HAL | CBOE |
| CRH | VMC | OMC | JKHY |
| AMP | GNRC | NRG | ALL |
| DIS | ETN | ZTS | PG |
| LRCX | EL | BRO | BMY |
| ZBRA | A | SNA | DG |
| MS | STLD | SYY | BF-B |
| GS | COO | AFL | DUK |
| NXPI | DAL | SRE | SW |
| ON | HST | TJX | LMT |
| TTD | NWS | RMD | BAX |
| KEYS | LULU | ORCL | SO |
| JBL | ISRG | IRM | DVA |
| NOW | TXT | KMI | D |
| GOOGL | PLTR | SLB | CAH |
| TEL | CMG | UNP | ELV |
| AMD | BEN | WST | KO |
| GOOG | GLW | HBAN | MRK |
| URI | J | WTW | AWK |
| EME | MCO | AON | EXE |
| MPWR | PNR | LVS | EQT |
| AMZN | V | EFX | LLY |
| ADI | PRU | MMM | MO |
| QCOM | RJF | MPC | T |
| WDAY | COHR | F | BDX |
| CRWD | CRL | WELL | MRNA |
| AVGO | DDOG | TPL | LNT |
| TSLA | HUBB | AJG | MKC |
| ADBE | NCLH | ADM | ES |
| STT | ALB | TSN | CMS |
| SNPS | WDC | COP | GILD |
| AME | TDG | HIG | TAP |
| INTU | NFLX | DXCM | HSY |
| BKNG | ANET | FOX | JNJ |
| PTC | EXPE | BKR | ABBV |
| IBKR | NWSA | MAA | SOLV |
| ARES | POOL | BXP | PFE |
| TER | ROK | SHW | AEP |
| AAPL | EMR | EBAY | COR |
| CRM | WY | MDT | NOC |
| TXN | MET | SNDK | VZ |
| APTV | IR | IBM | PGR |
| PH | PFG | PKG | CL |
| SWKS | NUE | BR | KMB |
| JCI | TYL | BSX | CNC |
| AXP | IEX | STX | WEC |
| IVZ | GRMN | IP | CHD |
| COF | HD | EA | MCK |
| MU | JPM | MNST | CLX |
| LIN | WFC | INVH | CAG |
| NTRS | GPN | DLR | HRL |
| ACN | XYL | EOG | ED |
| PANW | GM | GD | KVUE |
| BRK-B | ZBH | KR | |
| UAL | CPT | GIS | |
| CTSH | KIM | SJM | |
| BAC | OTIS | CPB | |
| TTWO | IFF | ||
| RL | RSG | ||
| CCL | DLTR | ||
| CSCO | WMT | ||
| PAYX | AVY | ||
| DE | EW | ||
| APP | CVX | ||
| GDDY | DOC | ||
| SPGI | LDOS | ||
| TECH | PSKY | ||
| DECK | GWW | ||
| PWR | MTB | ||
| ADP | AIZ | ||
| DOW | BALL | ||
| AMCR | UHS | ||
| DD | VLO | ||
| IQV | RTX | ||
| BA | UDR | ||
| NTAP | NEE | ||
| MGM | FOXA | ||
| NDAQ | MCD | ||
| VEEV | VTRS | ||
| HPQ | AVB | ||
| CMI | CNP | ||
| INTC | XOM | ||
| SYK | CINF | ||
| DELL | PSX | ||
| META | SATS | ||
| SBUX | CARR | ||
| COST | SMCI | ||
| ODFL | ESS | ||
| TPR | EXC | ||
| MSI | EQR | ||
| CSX | CHTR | ||
| VRT | DTE | ||
| CMCSA | FRT | ||
| TDY | HII | ||
| LOW | CME | ||
| WSM | NI | ||
| FICO | HSIC | ||
| CIEN | FSLR | ||
| LYV | CF | ||
| CTVA | REG | ||
| ALGN | WBD | ||
| RVTY | VRSK | ||
| HLT | APA | ||
| EPAM | VRTX | ||
| DASH | GPC | ||
| WAB | EG | ||
| TMUS | AKAM | ||
| L | PEG | ||
| AIG | NEM | ||
| MSCI | CCI | ||
| VRSN | EXPD | ||
| RCL | ORLY | ||
| LYB | ABT | ||
| FITB | HCA | ||
| TT | LHX | ||
| AES | AZO | ||
| ABNB | GL | ||
| CTAS | EIX | ||
| RF | KDP | ||
| USB | AMT | ||
| NSC | WM | ||
| IT | ROL | ||
| SWK | VLTO | ||
| STE | PSA | ||
| CFG | CASY | ||
| ITW | PEP | ||
| DRI | FANG | ||
| VICI | ACGL | ||
| CSGP | AMGN | ||
| DHR | DPZ | ||
| IDXX | UNH | ||
| FTV | CVS | ||
| GE | GEHC | ||
| ECL | O | ||
| CBRE | GEN | ||
| PNC | EXR | ||
| HWM | FE | ||
| LII | YUM | ||
| VST | CHRW | ||
| ALLE | PPL | ||
| LUV | TRV | ||
| FDS | MDLZ | ||
| TGT | CB | ||
| PLD | OXY | ||
| NKE | HUM | ||
| HON | |||
| NVR | |||
| BBY | |||
| MAR | |||
| EQIX | |||
| CVNA | |||
| ULTA | |||
| FAST | |||
| WYNN | |||
| DHI | |||
| ROP | |||
| CEG | |||
| SPG | |||
| SCHW | |||
| AXON | |||
| TKO | |||
| MAS | |||
| PODD | |||
| FISV | |||
| PHM | |||
| PCG | |||
| TRGP | |||
| FDX | |||
| LEN | |||
| FIS | |||
| PPG | |||
| TSCO | |||
| LITE | |||
| LH | |||
| TFC | |||
| BG |
Limitations & Future Work
- Static Clusters: This analysis captures correlation over the entire period; time-window clustering could reveal evolving relationships.
- Causality: Correlation does not imply causation; further econometric analysis (Granger causality, VAR models) could reveal causal links.
- Sector Granularity: A sector-level analysis could provide actionable insights for thematic portfolios.
- Real-time Updates: Automated reclustering and alerts could help investors track changing Bitcoin-equity relationships.
Analysis conducted on May 15, 2026. Data sourced from Yahoo Finance and Binance APIs. Methodology: K-means clustering on Pearson correlation coefficients of daily returns (2020-2026).